Tif2segy
| StartPage | WikiPages | AdditionalFiles |
The Unix shell script Tif2segy is a useful way of converting from an image of a seismic section, to a segy file. Many thanks to Andrew MacRae, the author of the script. This is a temporary page describing this script that will be removed once his official tif2segy page is online.
The author of this script, Seismic Unix, and Netpbm are not responsible for the content of any segy files. Use these tools at your own risk.
The script depends mainly on two other program suites:
The script is available for download from here: »upload/tif2segy
Note for users of little endian machines (Intel / AMD): The option endian=0 must be included with the segywrite command on line 100. For example, line 100 originally looks like this:
segywrite tape=$tiffile:r.segy bfile=binary hfile=tif2segy_header < $tiffile:r.suIt should be changed as follows:
segywrite tape=$tiffile:r.segy bfile=binary hfile=tif2segy_header endian=0 < $tiffile:r.su
This will write out a big endian segy file, which conforms to the SEGY standard.
The following is documentation written by Andrew MacRae:
First, the seismic section should be scanned at high enough resolution to see the shape of the individual traces with reasonable quality. The images should be scanned in greyscale (i.e. 8-bit greys) for best results, although black-and-white (1-bit) images at high enough resolution will also work. Before proceeding to steps B and C, you should convert a 1-bit image to greyscale.
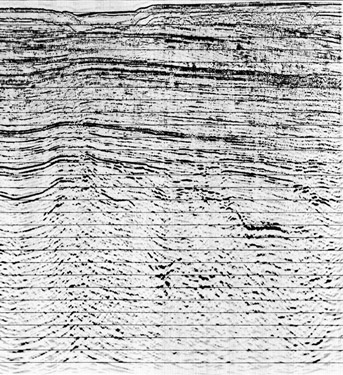
For typical paper sections, a good resolution is approximately 150 to 300 dots per inch (dpi). For microfiche, 1200 dpi is usually adequate, and you will need a scanner that handles transparencies. Here is an example greyscale (8-bit grey) image at suitable resolution, scanned from microfiche.


Images scanned at this resolution are REALLY BIG -- depending upon the length of the seismic section, the scanned image may be 5 to 70 megabytes in size, or even larger. So, make sure you have plenty of disk storage and a reasonably fast machine with plenty of memory to work with the images, or the process will be painfully slow. Some image programs do a better job with images of this size than others. Adobe Photoshop works well. Corel Photopaint less so, and it has other problems (see below), so it is not recommended (as of v.8 -- newer versions may be better).
After the image is scanned, it is usually necessary to slightly rotate it to ensure that the traces and samples are parallel to the edges of the image. If they are not, then the resulting SEG-Y file will be skewed. For good results, you may have to rotate the image by only fractions of a degree, and some image processing programs (such as Corel Photopaint) produce significant artifacts when rotating at small angles. Adobe Photoshop works well, as do more recent versions of Paintshop Pro (e.g., v.5).
The final step is to adjust the contrast and brightness of the image. Scanners often read paper as a very light grey, especially if the paper is yellowed and/or rough. You should adjust the contrast until the paper is white, and stretch the contrast until you have a good range of grey values.
Once you have your scanned image, you must prepare to turn it into an array of data that will be incorporated into the SEG-Y file. This involves three steps:
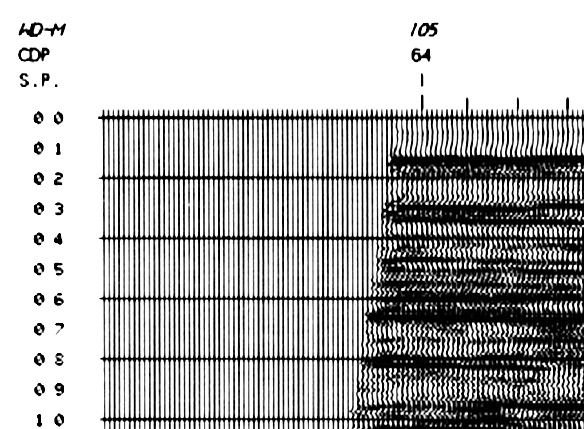
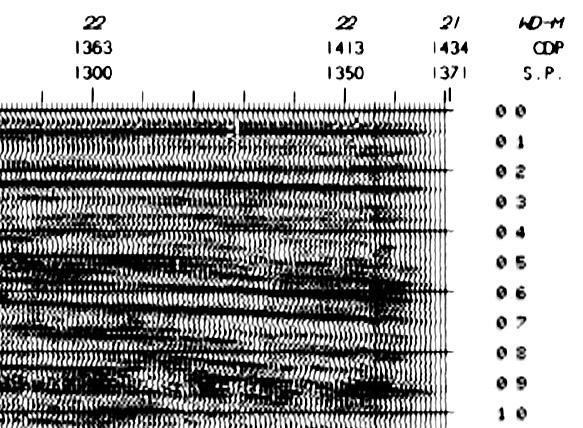
You want only the data portion of the image, so you should crop out the seismic section annotation, header, and the rest of the image outside the area of the wiggle plot of the seismic traces (see Figure 3, and compare to Figure 1). Crop the image between the 0 second and maximum time horizontally, and from the first to last trace. For the traces, it is important to crop between traces at either end that will have a known shotpoint or CDP value, so you can calculate the number of traces. For example, in the image above, the left edge (Figure 1) has the first shotpoint (SP) at the 64th trace, and the right edge has the last shotpoint, 1371, at the 1434th trace (Figure 4). Although extrapolation before or after these points is possible, things will be simpler if you simply crop to the first and last shotpoint for which you have corresponding navigation data. In this example, that is from shotpoint 1 to shotpoint 1371, and the time goes from 0 to 6 seconds.


The next step is to resize the cropped image so that each horizontal pixel of the image corresponds to a trace, and each vertical pixel position corresponds to a time sample. For the example used here, the seismic section has 1371 traces between shotpoint 1 and 1371, so the image must be 1371 pixels horizontally. For the vertical direction (time), the total time is 6 seconds. A typical sampling rate of 4 milliseconds corresponds to 250 samples per second, or 250*6 = 1500 samples in total -- i.e. the vertical image size should be 1500 pixels. The original image was 6864 x 1812 pixels, so the resulting 1371x1500 pixel image (Figure 5) is produced by non-proportional resizing. Make sure you do this by resampling the image with the highest-quality algorithm available (usually bicubic filtering or sometimes it is labelled as "antialias" mode). After resizing, it is usually desirable to adjust the contrast to get as good-looking an image as possible.

An important detail: make sure that the image is oriented with the lowest-value shotpoint on the left, with increasing shotpoint values to the right. This is necessary to get the correct orientation of the traces in the SEG-Y file. If your image is reversed from this orientation, use a "left-right flip" or "mirror" operation in the image processing program to orient it correctly before the next step.
Throughout the procedure so far, the image format used has been irrelevant, but the next step relies on TIFF format image files. Save the image files as TIFF. Make sure they are either uncompressed or use LZW compression -- do NOT use JPEG compression, because it is "lossy", and will not preserve all of the data exactly.
"tif2segy" is a program that runs within the UNIX C-shell, so this step of the process must be performed on a UNIX machine. The program depends upon the NetPBM image-processing tools and the Seismic Unix system, which do most of the conversion work. The programs of these packages must be in the user's command-path for tif2segy to work. If you do not know what this means or whether these two packages are installed, check with your system administrator. If they are not available, the program will warn you of the problem. Assuming tif2segy is also in your command-path, converting the TIFF image from the previous step into a SEG-Y file is simple:
tif2segy filename.tif
The SEG-Y file is output as "filename.segy" in the same directory. The "filename" portion of the name is also written into the EBCDIC header of the SEG-Y file. If you name the TIFF file with the survey name, name of the line, shotpoint range, and time (e.g., "8620-J008-001E_Line_ES-15A-M_sp1-1317_0-6s.tif"), the SEG-Y file will be self-documenting when the header is viewed.
NOTE 1: although tif2segy uses TIFF files as input, the code could be easily modified to use any 8-bit greyscale image format that is supported by NetPBM -- change the "tifftopnm" command to another image conversion program.
NOTE 2: the program assumes that the time sample interval is 4 milliseconds, but you could change this in the code by modifying the "interval" variable. If you are interested, here is the source code for tif2segy.
NOTE 3: The script writes out a descriptive header, including information on the creator of the segy file. Please edit tif2segy to modify the header to something appropriate. The author of this script, Seismic Unix, and Netpbm are not responsible for the content of any segy files. Use these tools at your own risk.
The default header will include this comment (replace the underscores with approriate information):
C
C      This SEGY file was created by _________________
C
C
C      File was converted using tif2segy, netpbm, and Seismic Unix
C      Author of tif2segy script is Andrew MacRae (andrew.macrae at smu.ca)
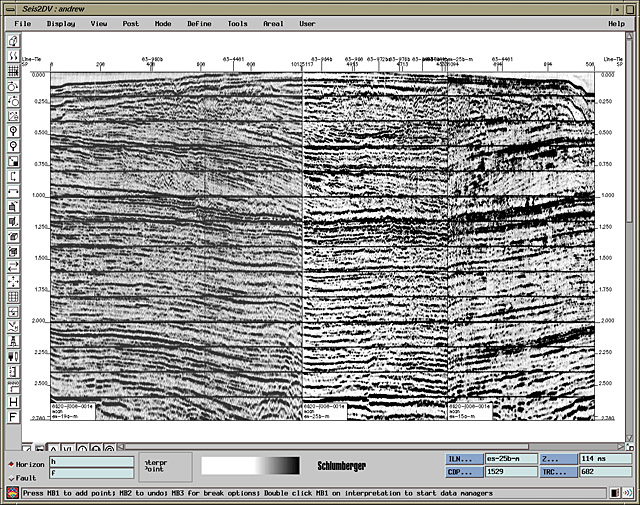
Loading the SEG-Y file into a seismic workstation system is beyond the scope of this document, but the procedure is basically the same as for most other seismic lines: load the SEG-Y file and merge it with the corresponding geographic navigation coordinates, based upon the shotpoints and shot to trace relationship. For this reason, it is essential that you keep track of the shotpoint/CDP data from the original paper section. Once loaded, you should verify your work by comparing the timing lines in the scanned image to the annotation provided by the workstation software, and by evaluating the quality of the ties between your scanned section and other seismic lines.
It is a bit fiddly, but the process to get a paper section scanned and into a digital workstation form is not difficult after a bit of practice, assuming you are already familar with image-processing programs and a bit of basic file manipulation on UNIX systems. The results are probably no better than if you had used a digitizing tablet to input an interpretation from paper, but there are great advantages to being able to work with scanned paper sections and original digital data simultaneously. For example, it means old, scanned paper sections can be used to fill in gaps in a newer digital program. If the image-processing steps are done carefully, even the ties between seismic sections and the registration of the scanned data to the timing lines and navigation can be quite good -- ties are sometimes as good as is seen between seismic lines in original digital data.

(Powered by PWP Version 1-4-3 )