This page shows how to filter a small part of a seismic section instead of the whole thing. As an example, a wide angle section could have NMO static correction applied to flatten the direct arrival, then a filter could be applied that only filters data beneath the direct arrival using the method described here. Finally the NMO correction would be removed, and the final section would be produced.
- The first step is to read in the file, and write a file with discwrite, which will be used later. These are processes 2 to 5 in the job file, make sure these are the only active processes.
- The next step is to display the data with Xview (only processes 7 and 8 should be active). We use the Xview window to create a mute file.
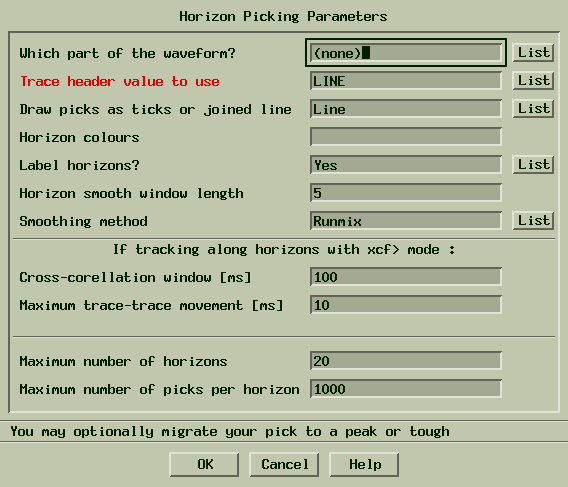
- Click on Digitise to select the parameters for digitizing. Select none for the waveform (so we can select arbitrary points) and use LINE for the trace header.

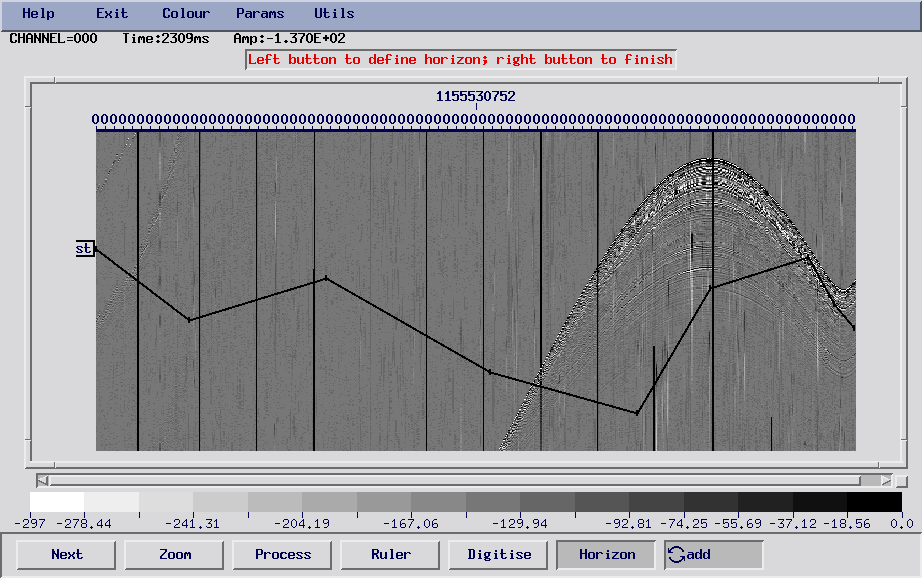
- Click on Horizon to make a name for the new horizon you're creating. Now start from left to right, and define a horizon. Data below (or above if you like) the horizon will be filtered, while the remaining part will be left unchanged. Click on exit, and give the mute a filename, give the file a .smu extension.

- Processes 10 to 18 should be active for the next step (not 17 unless you want to write an output file). The following steps are performed:
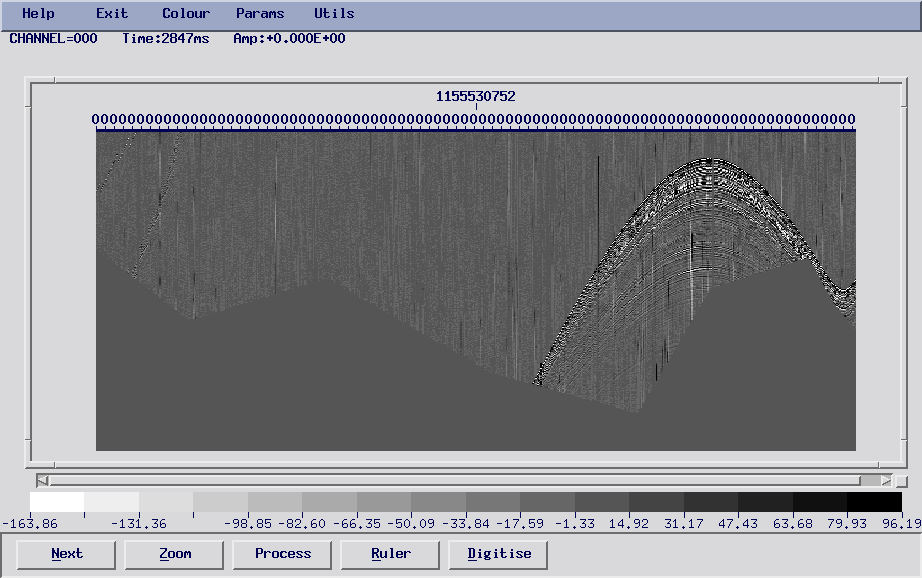
- The discwrite file is read and a mute is applied. This mutes everything below the mute as in this picture, and stores the result with DIFF1:

- The discwrite file is read again with reread and filtered with fdfilt (any other filter can be inserted here). The parameters for fdfilt were chosen to show a strong contrast between the unfiltered and filtered data. The same mute as before is applied, but everything above the mute is zeroed. The result is then combined with the data stored from DIFF1 using the X1+X2 option in DIFF2. This allows us to combine the unfiltered data with the filtered component. The two figures show the results:

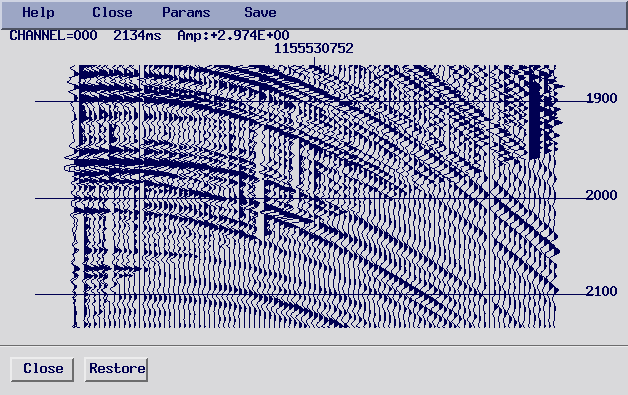
- This image shows a zoomed in window (variable wiggle plot) which shows the contact between the unfiltered and filtered data.

- Here is the job file that was used to make these figures. You will need an input file of your own, with the appropriate parameters »upload/filter_window.job. Download the file and run it with:
xsje filter_window.job


